JULY 11, 2025
Issue 7

Q: I want to look at pricing trends for properties with ADUs and DADUs in the MLS but I can't figure out how to do it.
Help!
A. I will always drop everything and help people figure out how to use NWMLS stats! Stats are super-powerful and more agents should utilize this powerhouse of information that we have at our fingertips.
However, just a word of warning: what you are asking for may be fraught with challenges until we get some additional tools to work with. Here is why:
- Some units that are classified as ADUs or DADUs (agents have classified them in the MLS) are not permitted as ADUs and DADUs, which can impact value. Unfortunately, we can't control what agents input. Once I had to weed through several dozen listings because I had a sales-to-list-price ratio in an area that was much lower than it should have been and what was throwing it off was an agent who had indicated the final sales price was only 10% of list price - I am pretty sure they just forgot a zero, but small errors like that can have a big impact. You should go into this exercise assuming that there will be discrepencies.
- Likewise, some of the ADU and DADU fields are somewhat new, so older sales and transitional sales will not be picked up. This phenomenon is similiar to what happens if you want to see your own buyer side sales before around 2008 - NWMLS didn't track it that far back.
- Denise's general rule of thumb for trends is you need at least 12 solds per month on average. If you are looking at a year timespan, that is 144 listings. If you aren't close to that, perhaps don't look at your results as a trend just yet.
- And finally, ADUs as a separate searchable categories are not yet available in the Matrix Stats section (which will impact your ability to pull stats for properties with ADUs), nor in Infosparks, so you will need to grab this data via a regular search.
But never fear! Shauna, the NWMLS research maven is here to help!
Here are the steps I would take to do a search:
RESEARCHING PROPERTIES WITH ADUs & DADUs
- Start with a General Single Family search. Choose the area you want to focus on. Choose "Sold" within the time period you want to focus on.
- Then, go to the ADU section which is on the right towards the bottom. You are looking for this:
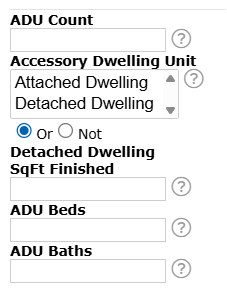
I would select both the fields for Attached Dwelling and Detached Dwelling.
For example, I selected Whatcom County, all sales between 1/1/2023 and 12/31/2023 and the result is 54 sales - everything from a 5th wheel with bunkhouse up in Sumas for $37,000 to an amazing property with a 270 degree view of the golf course and a casita for $1,600,000.
3. Once I have my listings, I would "Select All" and choose "Print" and then "CMA 1 Line (Landscape). Print a hard copy or just print to a pdf.
When I scroll to the end of the MLS listings (there was one unlisted one that I removed), I got the following results:

This indicates my median sales price for properties with an ADU or DADU in Whatcom County in 2023 was $895,000.
But remember! I only had 53 listings, far short from the 144 I need to call this a trend. Let's store it as food for thought for now, but let's not call it a trend just yet.
Now let's do the same thing for 2024! Here are the results:

58 listings show a median sales price of $965,000. Still not enough for a trend.
Interestingly enough, in the first six months of 2025, we have seen 35 sales of properties with ADUs! It feels like that number is ticking upwards.
Now, you may be thinking, "But Shauna, how do I create a snazzy graph with this data? I don't want to just provide my clients with a list. How boring!"
You CAN certainly create a graph of the data, but you are going to have to do some of your own data crunching. Here is how I would do it:
- Follow steps 1-2 above.
- Instead of hitting "Print", choose "Export" and use "Sold and Stats" for the format. This will provide you with a .csv file that you can open in Excel. It will give you the data on each individual listing, but not ALL the data. For example, it won't tell you if a listing had an ADU or a DADU (which would be great for doing some advanced analysis). But it will give you:
- Original list price
- Last list price
- Sale price
- Sale date
- Days on Market
- and a lot more! - With the data I downloaded, I created this simple graph in Excel (although you can also explore options for creating a graph in Canva if Excel is overwhelming to you):